
Inventory Reports in Appetize
Description: Learn about the Inventory Reports available in Appetize.
Inventory Sold Column Dictionary
|
Column Name |
Definition |
Calculation |
Example |
|---|---|---|---|
|
Wastes |
|
|
12 |
|
Wastes (Cost) |
|
Wastes * Item Cost |
12 * $0.50 = $6.00 |
|
Total Spoilage |
|
Comps + Wastes |
6 + 12 = 18 |
|
Total Spoilage (Cost) |
|
Comps (Cost) + Wastes (Cost) |
$6.00 + $3.00 = $9.00 |
|
Tax |
|
Sales - (Sales / (1 + Category Tax Rate)) |
$375.53 - ($375.53 / (1 + 0.08)) = $27.82 |
|
Sales |
|
Item Price * Quantity Sold |
$7.99 * 47 = $375.53 |
|
Quantity Sold |
|
|
47 |
|
Quantity Sold (Cost) |
|
Quantity Sold * Item Cost |
47 * $0.50 = $23.50 |
|
Quantity Sold / 1000 |
|
Quantity Sold / 1000 |
47/1000 = 0.047 |
|
Item Price |
|
|
$7.99 |
|
Item Cost |
|
|
$0.50 |
|
Gross Sales |
|
(Item Price * Quantity Sold) - Tax |
($7.99 * 47) - $27.82 = $347.71 |
|
Gross Profit |
|
Gross Sales - Quantity Sold (Cost) |
$347.71 - $23.50 = $324.31 |
|
Gross Profit % |
|
Gross Profit / Gross Sales |
$324.31 / $347.71 = 93.27% |
|
Cost of Sales |
|
Quantity Sold (Cost) + Total Spoilage (Cost) |
$23.50 + $9.00 = $32.50 |
|
Cost of Sales % |
|
Cost of Sales / Gross Sales |
$32.50 / $347.71 = 9.35% |
|
Comps |
|
|
6 |
|
Comps (Cost) |
|
Comps * Item Cost |
6 * $0.50 = $3.00 |
Standsheets Column Dictionary
|
Column Name |
Definition |
Calculation |
Example |
|---|---|---|---|
|
POS Sales |
|
|
47 |
|
POS Sales ($) |
|
Item Price * POS Sales |
$7.99 * 47 = $375.53 |
|
Begin Count |
|
|
80 |
|
Pre Event Transfers |
|
|
20 |
|
Expected Count In |
|
Begin Count + Pre Event Transfers |
80 + 20 = 100 |
|
Actual Count In |
|
|
71 |
|
Actual Count Out |
|
|
10 |
|
Count in Variance |
|
Actual Count In - Expected Count In |
100 - 71 = -29 |
|
Transfers In |
|
|
10 |
|
Transfers Out |
|
|
4 |
|
Transfers During |
|
Transfers In - Transfers Out |
10 - 4 = 6 |
|
Adjustment |
|
|
-2 |
|
Expected Sold |
|
Actual Count In + Transfers In - Transfers Out + Adjustment - Wastes - Comps - Actual Count Out |
71 + 10 - 4 + (-2) - 12 - 6 - 10 = 47 |
|
Inventory Sold ($) |
|
Item Price * Expected Sold |
$7.99 * 47 = $375.53 |
|
Sales Variance |
|
POS Sales - Expected Sold |
47 - 47 = 0 |
|
Sales Variance ($) |
|
Item Price * Sales Variance |
$7.99 * 0 = $0.00 |
Cash Reconciliation
The Cash Reconciliation report displays a breakdown of all cash actions recorded in the cash management module for a vendor or user on a given date range. Details include bank issued, cash drops collected and Cash sales. This report is most often used to reconcile cash received against reported cash sales and review over/shorts.
- Refresh: 10-15 minutes
- CSV, XLSX, Screen Print

Cost of Goods
The Cost of Goods report displays a breakdown by item of gross profit determined by subtracting the cost of units sold from inventory sales. Gross profit is calculated by gross sales (minus) cost of sales. This report is most often used to analyze profit margins for items based on inventory sales.
- Refresh: 25-30 minutes
- Export: CSV, XLSX, Screen Print

Inventory Value
The Inventory Valuation report is used to view the value of your inventory on hand quantity by item, broken down by GL Account or category for each warehouse and vendor where inventory is tracked. This report is often used to determine inventory levels and provide periodic inventory value for financial reporting.
- Refresh: 10-15 minutes
- Export: CSV, XLSX, Screen Print

Par Level Configurations
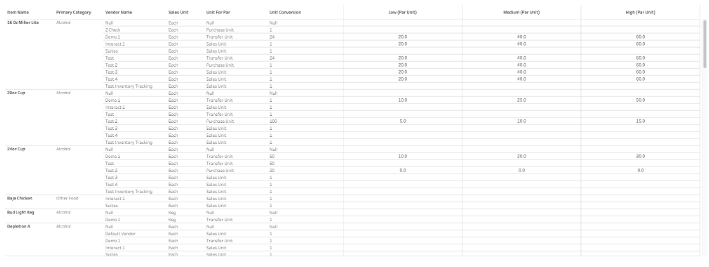
The Par Level Configurations report is a listing report of inventory items and their par level restock setup for each location (vendor) that is assigned. The report is used to help manage par restock levels for vendors.
- Refresh: 10-15 minutes
- Export: CSV, XLSX, Screen Print
Purchase Orders
The Purchase Orders report shows details of purchase orders made during a given period of time by the distributor, category, or item. This report is most often used to track items and quantity ordered, delivery, and supplier invoice matching for accounts payable reconciliation.
- Refresh: 10-15 minutes
- Export: CSV, XLSX, Screen Print

Recipe Book
The Recipe Book report is a listing report for how recipe items are built for inventory tracking. The report is most often used to determine ingredient level item mix of recipe items.
- Refresh: 10-15 minutes
- Export: CSV, XLSX, Screen Print

Revenue Reconciliation
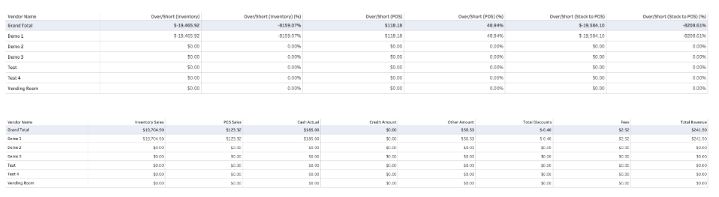
The Revenue Reconciliation report displays a summary of sales and revenue for each vendor and compares inventory sales against POS Sales and revenue grouped for a given event or period. This report is most often used to determine discrepancies between inventory and POS Sales, and revenue.
- Refresh: 25-30 minutes
- Export: CSV, XLSX, Screen Print
Sales Recap
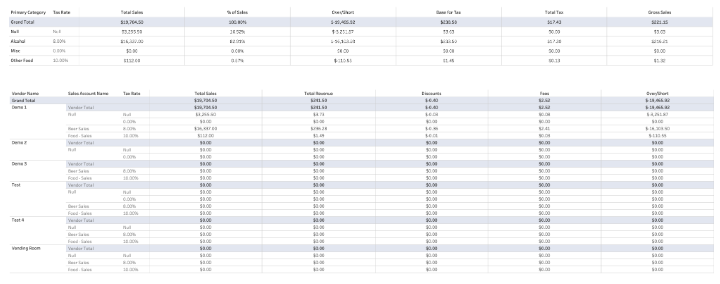
The Sales Recap report displays a breakdown of inventory sales by category or GL account, grouped by vendor for a given event or period. This report is most often used to analyze sales and expected revenue based on inventory standsheets.
- Refresh: 25-30 minutes
- Export: CSV, XLSX, Screen Print
Spoilage
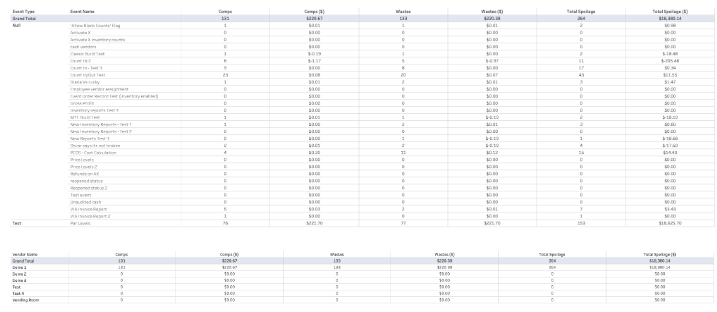
The Spoilage report displays a breakdown by item of waste and comps recorded on standsheets for a given event or period. The report is most often used to analyze and account for item usage not directly related to sales.
- Refresh: 10-15 minutes
- Export: CSV, XLSX, Screen Print
Standsheets
The Standsheets report displays a detailed breakdown of inventory counts and transfers used to determine inventory units sold compared to POS units sold. This report is most often used to review inventory count variances for a given event or period.
- Refresh: 10-15 minutes
- Export: CSV, XLSX, Screen Print

Transfers
The Transfers report shows details of transfers generated during a given period of time by status, category, or item. A transfer is when inventory is moved from one location to another, e.g., from a warehouse to a vendor. The report is most often used to track items, the quantity transferred, and their associated value based on item cost.
- Refresh: 10-15 minutes
- Export: CSV, XLSX, Screen Print

True Up Count Variance
The True Up Count Variance report shows details of inventory quantity variances and is most often used after a True Up Count has been completed for a given event. The report allows users to easily identify items that may not have been counted correctly so that a recount can be requested.
- Refresh: 10-15 minutes
- Export: CSV, XLSX, Screen Print
Units Sold
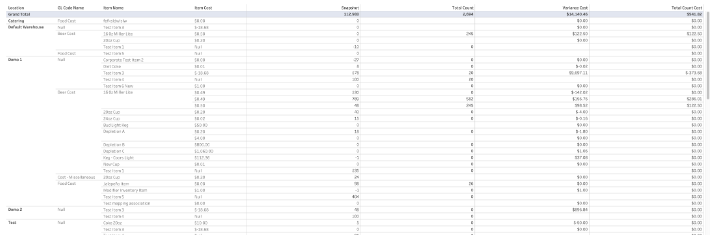
The Units Sold report displays a detailed breakdown of items sold based on the chargeable item counts on standsheets for a given event or period. The report is most often used to analyze the performance of sold items by revenue center, based on inventory sales.
- Refresh: 10-15 minutes
- Export: CSV, XLSX, Screen Print
